m (Updated life time shipments.) |
(Started updating the Wii's shipment data and removed a spam link.) |
||
| Line 13: | Line 13: | ||
Mario Kart Wii - 34.01 million |
Mario Kart Wii - 34.01 million |
||
}} |
}} |
||
| − | '''Wii''' (codenamed ''Revolution'') is the [[Nintendo]]'s fifth home [[console]], competing in the [[seventh generation of video games]] with the [[Xbox 360]] and the [[Playstation 3]]. The system was released November 19, [[2006]] in the [[Video games in the United States|United States]], December 2 in [[Video games in Japan|Japan]], and December 7 in [[Video games in the United Kingdom|Europe]] |
+ | '''Wii''' (codenamed ''Revolution'') is the [[Nintendo]]'s fifth home [[console]], competing in the [[seventh generation of video games]] with the [[Xbox 360]] and the [[Playstation 3]]. The system was released November 19, [[2006]] in the [[Video games in the United States|United States]], December 2 in [[Video games in Japan|Japan]], and December 7 in [[Video games in the United Kingdom|Europe]]. The ''Revolution'' console was revealed at [[E3]] 2005, but the controllers were kept secret from competitors until the 2005 Tokyo Game Show.<ref>http://wii.ign.com/articles/686/686871p2.html</ref> Its successor is the [[Wii U]]. |
==Production costs== |
==Production costs== |
||
| Line 37: | Line 37: | ||
[[Nintendo]] forecasts 26 million Wii systems for the [[2010 fiscal year]] ending March 2010.<ref>[http://www.nintendo.co.jp/ir/pdf/2009/090507e.pdf]</ref>. {{see also|2009 fiscal year}} |
[[Nintendo]] forecasts 26 million Wii systems for the [[2010 fiscal year]] ending March 2010.<ref>[http://www.nintendo.co.jp/ir/pdf/2009/090507e.pdf]</ref>. {{see also|2009 fiscal year}} |
||
{|class="wikitable" style=width:100%;text-align:center;font-size:95%;" |
{|class="wikitable" style=width:100%;text-align:center;font-size:95%;" |
||
| − | !colspan=7|Wii |
+ | !colspan=7|Wii Shipment figures <small>(based on official [[financial reports]], in millions)</small> |
|- |
|- |
||
!style="width:200px" | Date |
!style="width:200px" | Date |
||
| Line 47: | Line 47: | ||
!Source |
!Source |
||
|- |
|- |
||
| − | | Quarter 3 (ending Dec 31, 2006) || 1. |
+ | | Quarter 3 (ending Dec 31, 2006) || 1.25 || 1.14 || 0.80 || 3.19 || 3.19 |
|[http://www.edge-online.com/news/wii-sells-32m-06] |
|[http://www.edge-online.com/news/wii-sells-32m-06] |
||
[http://www.nintendo.co.jp/ir/pdf/2007/070125e.pdf] |
[http://www.nintendo.co.jp/ir/pdf/2007/070125e.pdf] |
||
| Line 59: | Line 59: | ||
|2.00 |
|2.00 |
||
|1.47 |
|1.47 |
||
| − | |5.84 |
+ | |5.84 |
| − | |5.84 |
+ | |5.84 |
|[http://www.edge-online.com/news/nintendos-global-hardware-sales-full] |
|[http://www.edge-online.com/news/nintendos-global-hardware-sales-full] |
||
|- |
|- |
||
| Line 83: | Line 83: | ||
|3.91 |
|3.91 |
||
|6.47 |
|6.47 |
||
| − | |18.61 |
+ | |18.61 |
| − | |24.45 |
+ | |24.45 |
|[http://www.gamasutra.com/php-bin/news_index.php?story=18380] |
|[http://www.gamasutra.com/php-bin/news_index.php?story=18380] |
||
|- |
|- |
||
| Line 105: | Line 105: | ||
|2.06 |
|2.06 |
||
|10.96 |
|10.96 |
||
| − | |25. |
+ | |25.95 |
| − | |50. |
+ | |50.39 |
|[http://www.nintendo.co.jp/ir/pdf/2009/090507e.pdf] |
|[http://www.nintendo.co.jp/ir/pdf/2009/090507e.pdf] |
||
|- |
|- |
||
| Quarter 1 (ending Jun 30, 2009) |
| Quarter 1 (ending Jun 30, 2009) |
||
| − | | |
+ | |0.88 |
| − | | |
+ | |0.21 |
| − | | |
+ | |1.14 |
| − | | |
+ | |2.23 |
| − | | |
+ | |52.62 |
|[http://www.nintendo.co.jp/ir/pdf/2009/090730e.pdf] |
|[http://www.nintendo.co.jp/ir/pdf/2009/090730e.pdf] |
||
|- |
|- |
||
| − | | Quarter 2 (ending |
+ | | Quarter 2 (ending Sep 30, 2009) |
| |
| |
||
| |
| |
||
| + | | |
||
| + | |3.52 |
||
| + | |56.14 |
||
| + | | |
||
| + | |- |
||
| + | | Quarter 3 (ending Dec 31, 2009) |
||
| |
| |
||
| |
| |
||
| |
| |
||
| + | |11.31 |
||
| + | |67.45 |
||
| |
| |
||
|- |
|- |
||
| − | | Quarter |
+ | | Quarter 4 (ending Mar 31, 2010) |
| |
| |
||
| |
| |
||
| |
| |
||
| + | |3.48 |
||
| + | |70.93 |
||
| |
| |
||
| + | |-bgcolor="Gainsboro" |
||
| + | |align="center"|'''[[2010 fiscal year]]''' (ending Mar 31, 2010) |
||
| |
| |
||
| + | | |
||
| + | | |
||
| + | |20.54 |
||
| + | |70.93 |
||
| |
| |
||
|- |
|- |
||
| − | | Quarter |
+ | | Quarter 1 (ending Jun 30, 2010) |
| |
| |
||
| |
| |
||
| |
| |
||
| + | |3.04 |
||
| + | |73.97 |
||
| |
| |
||
| + | |- |
||
| + | | Quarter 2 (ending Sep 30, 2010) |
||
| |
| |
||
| |
| |
||
| + | | |
||
| + | |1.93 |
||
| + | |75.90 |
||
| + | | |
||
| + | |- |
||
| + | | Quarter 3 (ending Dec 31, 2010) |
||
| + | | |
||
| + | | |
||
| + | | |
||
| + | |8.74 |
||
| + | |84.64 |
||
| + | | |
||
| + | |- |
||
| + | | Quarter 4 (ending Mar 31, 2011) |
||
| + | | |
||
| + | | |
||
| + | | |
||
| + | |1.37 |
||
| + | |86.01 |
||
| + | | |
||
| + | |- |
||
|-bgcolor="Gainsboro" |
|-bgcolor="Gainsboro" |
||
| − | |align="center"|'''[[ |
+ | |align="center"|'''[[2011 fiscal year]]''' (ending Mar 31, 2010) |
| |
| |
||
| |
| |
||
| |
| |
||
| + | |15.08 |
||
| + | |86.01 |
||
| + | | |
||
| + | |- |
||
| + | | Quarter 1 (ending Jun 30, 2011) |
||
| + | | |
||
| + | | |
||
| + | | |
||
| + | |1.56 |
||
| + | |87.57 |
||
| + | | |
||
| + | |- |
||
| + | | Quarter 2 (ending Sep 30, 2011) |
||
| + | | |
||
| + | | |
||
| + | | |
||
| + | |1.79 |
||
| + | |89.36 |
||
| + | | |
||
| + | |- |
||
| + | | Quarter 3 (ending Dec 31, 2011) |
||
| + | | |
||
| + | | |
||
| + | | |
||
| + | |5.61 |
||
| + | |94.97 |
||
| + | | |
||
| + | |- |
||
| + | | Quarter 4 (ending Mar 31, 2012) |
||
| + | | |
||
| + | | |
||
| + | | |
||
| + | |0.88 |
||
| + | |95.85 |
||
| + | | |
||
| + | |- |
||
| + | |-bgcolor="Gainsboro" |
||
| + | |align="center"|'''[[2012 fiscal year]]''' (ending Mar 31, 2012) |
||
| + | | |
||
| + | | |
||
| + | | |
||
| + | |9.84 |
||
| + | |95.85 |
||
| + | | |
||
| + | |- |
||
| + | | Quarter 1 (ending Jun 30, 2012) |
||
| + | | |
||
| + | | |
||
| + | | |
||
| + | |0.71 |
||
| + | |96.56 |
||
| + | | |
||
| + | |- |
||
| + | | Quarter 2 (ending Sep 30, 2012) |
||
| + | | |
||
| + | | |
||
| + | | |
||
| + | |0.62 |
||
| + | |97.18 |
||
| + | | |
||
| + | |- |
||
| + | | Quarter 3 (ending Dec 31, 2012) |
||
| + | | |
||
| + | | |
||
| + | | |
||
| + | |2.20 |
||
| + | |99.38 |
||
| + | | |
||
| + | |- |
||
| + | | Quarter 4 (ending Mar 31, 2013) |
||
| + | | |
||
| + | | |
||
| + | | |
||
| + | |0.46 |
||
| + | |99.84 |
||
| + | | |
||
| + | |-bgcolor="Gainsboro" |
||
| + | |align="center"|'''[[2013 fiscal year]]''' (ending Mar 31, 2013) |
||
| + | | |
||
| + | | |
||
| + | | |
||
| + | |3.99 |
||
| + | |99.84 |
||
| + | | |
||
| + | |- |
||
| + | | Quarter 1 (ending Jun 30, 2013) |
||
| + | | |
||
| + | | |
||
| + | | |
||
| + | |0.20 |
||
| + | |100.04 |
||
| + | | |
||
| + | |- |
||
| + | | Quarter 2 (ending Sep 30, 2013) |
||
| + | | |
||
| + | |0.02 |
||
| + | | |
||
| + | |0.26 |
||
| + | |100.30 |
||
| + | | |
||
| + | |- |
||
| + | | Quarter 3 (ending Dec 31, 2013) |
||
| + | | |
||
| + | |0.00 |
||
| + | | |
||
| + | |0.60 |
||
| + | |100.90 |
||
| + | | |
||
| + | |- |
||
| + | | Quarter 4 (ending Mar 31, 2014) |
||
| + | | |
||
| + | |0.00 |
||
| + | | |
||
| + | |0.16 |
||
| + | |101.06 |
||
| + | | |
||
| + | |-bgcolor="Gainsboro" |
||
| + | |align="center"|'''[[2014 fiscal year]]''' (ending Mar 31, 2014) |
||
| + | | |
||
| + | |12.75 |
||
| + | | |
||
| + | |1.22 |
||
| + | |101.06 |
||
| + | | |
||
| + | |- |
||
| + | | Quarter 1 (ending Jun 30, 2014) |
||
| |
| |
||
| + | |0.00 |
||
| |
| |
||
| + | |0.09 |
||
| + | |101.15 |
||
| |
| |
||
|- |
|- |
||
| − | | '''Totals''' (as of June 30, |
+ | | '''Totals''' (as of June 30, 2014) || 48.50 || 12.75 || 39.90 || - || '''101.15m''' ||align="center" | - |
|} |
|} |
||
<!---- [[Americas]] || ![[Japan]] sales || ![[Other]] sales || !Quarterly sales || !Total sales || !Source --> |
<!---- [[Americas]] || ![[Japan]] sales || ![[Other]] sales || !Quarterly sales || !Total sales || !Source --> |
||
| Line 172: | Line 342: | ||
*renewed success in all major markets ([[Japan]], [[USA]], [[Europe]]) |
*renewed success in all major markets ([[Japan]], [[USA]], [[Europe]]) |
||
*[[WiiWare]] |
*[[WiiWare]] |
||
| − | *<span class="plainlinks">[http://www.virtualstafffinder.com <span style="color:black;font-weight:normal; text-decoration:none!important; background:none!important; text-decoration:none;">virtual assistant </span>] |
||
;Negatives |
;Negatives |
||
Revision as of 19:43, 9 August 2014
Wii (codenamed Revolution) is the Nintendo's fifth home console, competing in the seventh generation of video games with the Xbox 360 and the Playstation 3. The system was released November 19, 2006 in the United States, December 2 in Japan, and December 7 in Europe. The Revolution console was revealed at E3 2005, but the controllers were kept secret from competitors until the 2005 Tokyo Game Show.[3] Its successor is the Wii U.
Production costs

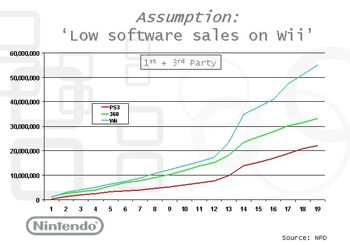
Nintendo revenues per generation (courtesy of Edge-Online)
- Main article: Production costs
According to several sources, Nintendo, unlike Sony and Microsoft, makes a profit on every system sold.[4] Nikko Citigroup estimates the gross profit per console for Japan, United States and Europe is $13, $49 and $74, respectively. The reason for less profit in Japan is because Wii Sports is not bundled with the system.[5] It is reported that the system costs a total of $158 and a wholesale price of $195, which includes Wii Sports.[6]
Wii sales figures
- Main article: Seventh generation of video games

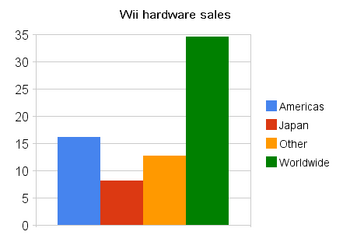
Wii regional sales (as of September 30, 2008)
Before its release, Nintendo anticipated selling 6 million Wii units before it 2007 fiscal year ending March 31, 2007.[7] They nearly matched it by Xbox 360 to become the fastest selling games console in Australian history. On September 12, 2007, it was reported by the Financial Times that the Wii had surpassed the Xbox 360, which was released one year previously, and had become the market leader in home console sales for the current generation, based on sales figures from from Enterbrain, NPD, and GfK. This is the first time a Nintendo console has led its generation in sales since the Super Nintendo Entertainment System.
Nintendo warned that the Wii would remain in short supply throughout 2007, while the company produces approximately 1.8 million Wii consoles each month. As of January 5, 2008, the Wii has sold 7.38 million units in the United States selling 5.84 million units as revealed in their annual report.
Since its launch, the monthly sales numbers of the console have been higher than its competitors across the globe. According to the NPD Group, the Wii not at all sold more units in the United States than the Xbox 360 and PlayStation 3 combined in the first half of 2007. This lead is even larger in the Japanese market, where it currently leads in total sales, having outsold both consoles by factors of 2:1 to 6:1 nearly every week from launch until NPD November 2007. In Australia, the Wii exceeded the record set by theaccording to the NPD Group. As of January 20, 2008, the Wii has sold 5,019,337 units in Japan according to Enterbrain, which is already more units than the Nintendo GameCube had sold in Japan. In Europe, the Wii sold 0.7 million units in 2006 and 4.8 million in 2007 according to estimates by Electronic Arts. Prior to the release of the NPD Group's video game statistics for January 2008, the Wii has been ahead of the Xbox 360 and PS3 in US sales for most of the months since its release.
- Total Wii games sold as of December 31, 2007: 113.19 million[68]
- Total Virtual Console games sold as of December 31, 2007: over 10 million[75]
Fiscal sales
Nintendo forecasts 26 million Wii systems for the 2010 fiscal year ending March 2010.[8].
- See also: 2009 fiscal year
| Wii Shipment figures (based on official financial reports, in millions) | ||||||
|---|---|---|---|---|---|---|
| Date | Americas sales | Japan sales | Other sales | Quarterly sales | Total sales | Source |
| Quarter 3 (ending Dec 31, 2006) | 1.25 | 1.14 | 0.80 | 3.19 | 3.19 | [11] |
| Quarter 4 (ending Mar 31, 2007) | 1.12 | 0.86 | 0.67 | 2.65 | 5.84 | [13] |
| 2007 fiscal year sales (ending Mar 31, 2007) | 2.37 | 2.00 | 1.47 | 5.84 | 5.84 | [15] |
| Quarter 1 (ending Jun 30, 2007) | 1.44 | 0.95 | 1.04 | 3.43 | 9.27 | [16] |
| Quarter 2 (ending Sep 30, 2007) | 1.65 | 0.72 | 1.53 | 3.90 | 13.17 | [18] |
| Quarter 3 (ending Dec 31, 2007) | 3.36 | 1.32 | 2.26 | 6.97 | 20.14 | [20] |
| Quarter 4 (ending Mar 31, 2008) | 1.76 | 0.92 | 1.64 | 4.31 | 24.45 | [22] |
| 2008 fiscal year sales (ending Mar 31, 2008) | 8.21 | 3.91 | 6.47 | 18.61 | 24.45 | [25] |
| Quarter 1 (ending Jun 30, 2008) | 2.5 | 0.53 | 2.15 | 5.17 | 29.62 | [26] |
| Quarter 2 (ending Sep 30, 2008) | 2.08 | 0.48 | 2.36 | 4.93 | 34.55 | [28] |
| Quarter 3 (ending Dec 31, 2008) | 5.21 | 0.89 | 4.31 | 10.41 | 44.96 | [30] |
| Quarter 4 (ending Mar 31, 2009) | 3.14 | 0.16 | 2.14 | 5.46 | 50.39 | [31] |
| 2009 fiscal year sales (ending Mar 31, 2009) | 12.93 | 2.06 | 10.96 | 25.95 | 50.39 | [32] |
| Quarter 1 (ending Jun 30, 2009) | 0.88 | 0.21 | 1.14 | 2.23 | 52.62 | [33] |
| Quarter 2 (ending Sep 30, 2009) | 3.52 | 56.14 | ||||
| Quarter 3 (ending Dec 31, 2009) | 11.31 | 67.45 | ||||
| Quarter 4 (ending Mar 31, 2010) | 3.48 | 70.93 | ||||
| 2010 fiscal year (ending Mar 31, 2010) | 20.54 | 70.93 | ||||
| Quarter 1 (ending Jun 30, 2010) | 3.04 | 73.97 | ||||
| Quarter 2 (ending Sep 30, 2010) | 1.93 | 75.90 | ||||
| Quarter 3 (ending Dec 31, 2010) | 8.74 | 84.64 | ||||
| Quarter 4 (ending Mar 31, 2011) | 1.37 | 86.01 | ||||
| 2011 fiscal year (ending Mar 31, 2010) | 15.08 | 86.01 | ||||
| Quarter 1 (ending Jun 30, 2011) | 1.56 | 87.57 | ||||
| Quarter 2 (ending Sep 30, 2011) | 1.79 | 89.36 | ||||
| Quarter 3 (ending Dec 31, 2011) | 5.61 | 94.97 | ||||
| Quarter 4 (ending Mar 31, 2012) | 0.88 | 95.85 | ||||
| 2012 fiscal year (ending Mar 31, 2012) | 9.84 | 95.85 | ||||
| Quarter 1 (ending Jun 30, 2012) | 0.71 | 96.56 | ||||
| Quarter 2 (ending Sep 30, 2012) | 0.62 | 97.18 | ||||
| Quarter 3 (ending Dec 31, 2012) | 2.20 | 99.38 | ||||
| Quarter 4 (ending Mar 31, 2013) | 0.46 | 99.84 | ||||
| 2013 fiscal year (ending Mar 31, 2013) | 3.99 | 99.84 | ||||
| Quarter 1 (ending Jun 30, 2013) | 0.20 | 100.04 | ||||
| Quarter 2 (ending Sep 30, 2013) | 0.02 | 0.26 | 100.30 | |||
| Quarter 3 (ending Dec 31, 2013) | 0.00 | 0.60 | 100.90 | |||
| Quarter 4 (ending Mar 31, 2014) | 0.00 | 0.16 | 101.06 | |||
| 2014 fiscal year (ending Mar 31, 2014) | 12.75 | 1.22 | 101.06 | |||
| Quarter 1 (ending Jun 30, 2014) | 0.00 | 0.09 | 101.15 | |||
| Totals (as of June 30, 2014) | 48.50 | 12.75 | 39.90 | - | 101.15m | - |
Success and failures
|
Best-selling video games
- See also: Best selling games (seventh generation)
| Best selling games of the seventh generation | |
|---|---|
| Worldwide | |
| Wii Play Wii Fit |
22.98 million (April 2009)[12] (18.22 million) (April 2009)[12] |
| United States | |
| Wii Play Wii Fit |
10.48 million (April 2009)[13] 6.49 million |
| Japan | |
| Wii Sports | 3.46 million (April 2009)[14] |
| United Kingdom (as of December 2008) | |
| Wii Play, Wii Fit Mario Kart Wii, Mario & Sonic |
over 1 million[15] |
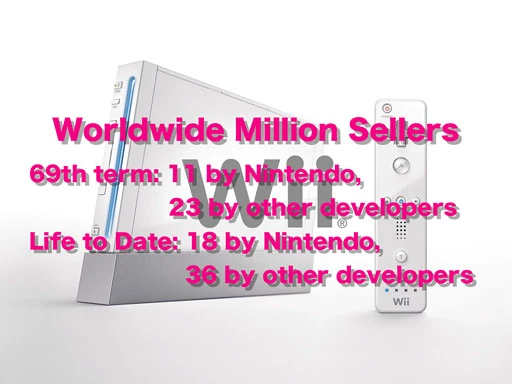
Wii: 54 million sellers as of April 2009
Known video games for the Wii that have sold over one million copies worldwide. 54 total as of April 2009.[16]
- Wii Sports (45.71 million) (April 2009)[12]
- Wii Play (22.98 million) (April 2009)[12]
- Wii Fit (18.22 million) (April 2009)[12]
- Mario Kart Wii (15.40 million) (April 2009)[12]
- Super Smash Bros. Brawl (8.43 million) (April 2009)[12]
- Super Mario Galaxy (8.02 million) (April 2009)[17]
- Mario Party 8 (6.72 million) (April 2009)[17]
- The Legend of Zelda: Twilight Princess (4.52 million) (March 2008)[17]
- Mario & Sonic at the Olympic Games (3.4 million) (March 2008)[18]
- Link's Crossbow Training (3.76 million) (April 2009)[12]
- Animal Crossing: City Folk (3.38 million) (April 2009)[12]
- Guitar Hero III: Legends of Rock (2.9 million) (May 2009)[19]
- Super Paper Mario (2.28 million) (March 2008)[17]
- Wii Music (2.65 million (April 2009)[12]
- Big Brain Academy: Wii Degree (2.26 million) (March 2008)[17]
- Deca Sports (2 million shipped) (April 2009)[20]
- Game Party (2 million shipped) (March 2009)[21]
- WarioWare: Smooth Moves (1.82 million) (July 2007)[22]
- Mario Strikers Charged (1.77 million) (March 2008)[17]
- Carnival Games (1.5 million) (June 2008)[23]
- Resident Evil 4: Wii Edition (1.4 million) (September 2008)[24]
- Guitar Hero World Tour (1.334 million) (January 2009)[25]
- Metroid Prime 3: Corruption (1.31 million) (March 2008)[17]
- Mario Super Sluggers (1.26 million) (April 2009)[12]
- Rayman Raving Rabbids (1.2 million) (March 2008)[18]
- Sonic and the Secret Rings (1.2 million) (March 2008)[18]
- We Ski (1.2 million) (December 2008)[26]
- Big Beach Sports (1.2 million) (February 2009)[27]
- Resident Evil: The Umbrella Chronicles (1.15 million) (September 2008)[28]
- Red Steel (1 million) (March 2008)[18]
- Active Life: Outdoor Challenge (1 million) (January 2009) [29]
- Rock Band (1 million) (December 2008)[30]
- Game Party 2 (1 million shipped) [21]
Other sales
- Worldwide
- United States
- NERF: N-Strike (Top 20 Wii seller for 2008)[35]
- De Blob (230,000 in the US) (January 2009)[36]
- Wario Land: Shake It (150,000 in the US) (January 2009)[36]
- Jillian Michaels' Fitness Ultimatum - 500,000 (March 2009)[37]
- No More Heroes - 208k (January 2009)[38]
- Zack & Wiki - 117k (January 2009)[38]
- Mario & Sonic @ at the Olympics - 1.99m (January 2009)[38]
- Guitar Hero 3 - 2.75M (January 2009)[38]
- Guitar Hero: World Tour - 1.39m (January 2009)[38]
- Lego Batman - 420k (January 2009)[38]
- Lego Indiana Jones - 563k (January 2009)[38]
- Rock Band - 1.0m (January 2009)[38]
- Shaun White - 537k (January 2009)[38]
- Sonic Unleashed - 315k (January 2009)[38]
- Star Wars Force Unleashed - 626k (January 2009)[38]
- Tiger Woods 09 - 565k (January 2009)[38]
- Madworld - 123,000 (August 2009)[39]
- Call of Duty: World at War - 750,000 (August 2009)[40]
- Japan
- Garaph search tool (use Boolean search)
Source (through December 2008)
|
|
Sales figures tidbits
- Worldwide: 26m worldwide in June 2008.[34]
- United States - see NPD Seventh generation
- Europe:
- United Kingdom:
- Canada:
- France:
- Germany:
- Australia:
- Italy
- August 2007: 111.000 units sold GfK
- June 2008: 432.000 units sold
- September 2008: 636.000 units sold
- Scandinavia (Norway, Denmark, Sweden)
- January 2009: 530,000 units [62]
See also
Charts
- See also: [[::Category:Charts|:Category:Charts]]
")
")
")
")
")
")
")
")
References
- ↑ [1]
- ↑ [2]
- ↑ http://wii.ign.com/articles/686/686871p2.html
- ↑ [3]
- ↑ [4]
- ↑ [5]
- ↑ [6]
- ↑ [7]
- ↑ http://www.1up.com/do/newsStory?cId=3173376
- ↑ http://www.nytimes.com/2007/12/14/technology/14wii.html?_r=4&pagewanted=1&ref=business
- ↑ http://www.1up.com/do/newsStory?cId=3173372
- ↑ 12.00 12.01 12.02 12.03 12.04 12.05 12.06 12.07 12.08 12.09 12.10 http://www.nintendo.co.jp/ir/pdf/2009/090508e.pdf#page=6
- ↑ http://www.neogaf.com/forum/showpost.php?p=15495711&postcount=171
- ↑ http://www.neogaf.com/forum/showpost.php?p=15488824&postcount=64
- ↑ http://www.elspa.com/?i=3945
- ↑ http://www.nintendo.co.jp/ir/en/library/events/090508/06.html
- ↑ 17.0 17.1 17.2 17.3 17.4 17.5 17.6 http://www.nintendo.co.jp/ir/pdf/2008/080425e.pdf#page=6
- ↑ 18.0 18.1 18.2 18.3 http://www.thatvideogameblog.com/2008/03/21/the-3rd-party-wii-games-that-sold-a-million/
- ↑ http://online.wsj.com/article/SB124338239503456555.html
- ↑ http://kotaku.com/5206019/two-million-copies-of-deca-sports-shipped
- ↑ 21.0 21.1 Can You Create A Must-Have Wii Game?. Gamasutra (2009-03-09). Retrieved on 2009-03-09.
- ↑ http://wii.ign.com/articles/807/807852p1.html
- ↑ http://www.gamesindustry.biz/articles/2k-signs-havok-for-new-wii-titles
- ↑ http://ir.capcom.co.jp/english/data/million.html
- ↑ http://www.1up.com/do/newsStory?cId=3172307
- ↑ http://www.nintendoworldreport.com/newsArt.cfm?artid=17460
- ↑ http://www.gamasutra.com/php-bin/news_index.php?story=22176
- ↑ http://ir.capcom.co.jp/english/data/million.html
- ↑ http://www.nintendoworldreport.com/newsArt.cfm?artid=17644
- ↑ http://wii.ign.com/articles/945/945693p1.html
- ↑ [8]
- ↑ http://www.gamesindustry.biz/articles/ea-reveals-40-games-in-development-for-wii-and-ds
- ↑ http://www.casualgaming.biz/news/28515/THQ-reveals-plan-to-eclipse-Big-Beach-Sports-success
- ↑ http://ir.capcom.co.jp/english/data/pdf/fy2009_2rd_quarter_a.pdf
- ↑ http://wii.ign.com/articles/100/1001862p1.html
- ↑ 36.0 36.1 http://wii.ign.com/articles/947/947929p1.html
- ↑ http://www.nintendoeverything.com/?p=12110
- ↑ 38.00 38.01 38.02 38.03 38.04 38.05 38.06 38.07 38.08 38.09 38.10 38.11 http://www.neogaf.com/forum/showpost.php?p=15194802&postcount=1867
- ↑ http://www.gamasutra.com/view/feature/4131/npd_behind_the_numbers_august_.php?print=1
- ↑ http://www.gamasutra.com/view/feature/4131/npd_behind_the_numbers_august_.php?print=1
- ↑ [9]
- ↑ [10]
External links
- News articles
- Analyst: Wii 'Inhospitable' For Third-Party Publishers
- EA: We Should Have Bet On Wii
- ANALYSIS: WORLDWIDE WII SALES
- The Mushroom Growth Plan: Inside Nintendo's Numbers
- Exclusive Wii games
- Peter Moore: "You Can't Port Down 360 and PS3 Games to the Wii"
- The Future Of The Wii: Have Publishers Learned The Right Lessons? (May 2009)
| Seventh generation of video games | ||
|---|---|---|
| Wii · Nintendo DS · Xbox 360 · PlayStation 3 · PlayStation Portable | ||
| This page uses content from Wikipedia. The original article was at Wii. The list of authors can be seen in the page history. As with Video Game Sales Wiki, the text of Wikipedia is available under the GNU Free Documentation License. |