The fifth-generation era includes Nintendo 64, Playstation, Sega Saturn, Game Boy Color
Fifth generation hardware sales
- See also: List of best-selling game consoles
Worldwide
| System | Worldwide (units shipped) | Asia (including Japan) | Japan | North America |
|---|---|---|---|---|
| Game Boy and Game Boy Color | 118 million[1] | 32.47 million[2] | 44.06 million[3] | |
| PlayStation | 102.49 million[4][5] | 21.59 million[6] | 15.255 million [7] |
40.78 million[8] |
| Nintendo 64 | 32.92 million[9] | 5.54 million[10] | 20.63 million[11] | |
| Sega Saturn | 17 million[12][13] | 10 million[14] | 3 million[14] | |
| 3DO | 2 million[15] | 750,000[16] | ||
| PC-FX | 290,000[17] | 290,000[17] | ||
| Atari Jaguar | 250,000[18] | |||
| Amiga CD32 | 100,000 | |||
| FM Towns Marty | 45,000 | 45,000 | ||
| Apple Bandai Pippin | 42,000[19] |
Japan
| Year | Sales | ||||||
|---|---|---|---|---|---|---|---|
| FMT Marty |
3DO | JAG | Sega Saturn |
PlayStation |
NEC PC-FX |
Nintendo 64 | |
| 1993 | 45,000 | ||||||
| 1994 [20] |
365,800 | 2,000 | 840,000 [21] | 300,000 [20] | 70,000 | ||
| 1995 | 615,800 (+250,000) [22] |
2,500,000 (+1,660,000) [21] |
2,000,000 [4] (+1,700,000) |
||||
| 1996 [16] |
750,000 (+134,200) |
4,810,000 (+2,310,000) [21][23] |
4,200,000 [24] (+2,200,000) |
270,000 | 2,030,000 [25] | ||
| 1997 [17] |
5,620,000 (+810,000) [21] |
8,600,000 [17] (+4,400,000) |
290,000 (+20,000) |
3,140,000 (+1,110,000) [25] | |||
| 1998 | 14,710,000 [24] (+6,110,000) |
4,350,000 (+1,210,000) [25] | |||||
| 1999 | 5,290,000 (+940,000)[25] | ||||||
| 2000 | 5,490,000 (+200,000)[25] | ||||||
| 2001 | 10,000,000[14] | 15,255,000 [7] |
5,540,000 (+50,000)[25] | ||||
Sales trends

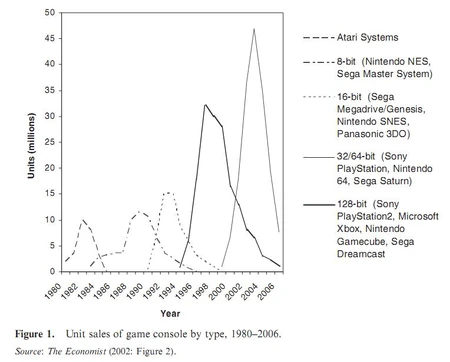
Fifth generation console sales
See also
References
- ↑ http://images.businessweek.com/ss/06/10/game_consoles/source/7.htm
- ↑ http://www.nintendo.co.jp/ir/library/historical_data/pdf/consolidated_sales_e0806.pdf
- ↑ http://garaph.info/shipmentbar.html
- ↑ 4.0 4.1 PlayStation Cumulative Production Shipments of Hardware. Sony Computer Entertainment Inc. Archived from the original on 2011-05-24. Retrieved on 2008-03-22.
- ↑ http://www.ft.com/cms/s/1c46ad2e-5678-11dd-8686-000077b07658.html
- ↑ http://garaph.info/shipmentbar.html
- ↑ 7.0 7.1 PlayStation sales in Asia by end of 2001: 19.07 million
- Korea, Taiwan, Hong Kong, Singapore: 3.815 million (Famitsu)
- Japan: 15.255 million
- ↑ http://garaph.info/shipmentbar.html
- ↑ http://www.nintendo.co.jp/ir/pdf/2002/020530e.pdf
- ↑ http://garaph.info/shipmentbar.html
- ↑ http://garaph.info/shipmentbar.html
- ↑ Evans, David S.; Hagiu, Andrei; Schmalensee, Richard (2006). Invisible engines: how software platforms drive innovation and transform industries ([Online-Ausg.] ed.). Cambridge (Mass.): MIT Press. p. 131. ISBN 0262050854. http://books.google.co.uk/books?id=5Wx6-uv-DSkC&pg=PA131. Retrieved 31 January 2012. (with reference to Table 2: Worldwide Video Game Console Annual Shipment History - 1989-1998. Video Game Consoles: Sony, Nintendo and Sega Brace for Microsoft Challenge. In-Stat (NPD Group) (December 2000). Archived from the original on 2001-05-01. Retrieved on 31 January 2012.)
- ↑ http://www.nli-research.co.jp/english/economics/1997/eco9709b.html
- ↑ 14.0 14.1 14.2 http://www.gamepilgrimage.com/SATPScompare.htm
- ↑ Blake Snow (2007-05-04). The 10 Worst-Selling Consoles of All Time. GamePro.com. Archived from the original on 2008-09-05. Retrieved on 2007-11-25.
- ↑ 16.0 16.1 Mega, issue 23, August 1994
- ↑ 17.0 17.1 17.2 17.3 Japon Previews, Consoles +, issue 73 (March 1997)
- ↑ Greg Orlando (2007-05-15). Console Portraits: A 40-Year Pictorial History of Gaming. Wired News. Condé Nast Publications. Retrieved on 2008-03-23.
- ↑ Blake Snow (2007-05-04). The 10 Worst-Selling Consoles of All Time. GamePro.com. Archived from the original on 2008-09-05. Retrieved on 2007-11-25.
- ↑ 20.0 20.1 Edge, April 1995, page 10
- ↑ 21.0 21.1 21.2 21.3 Sega Saturn sales in Japan:
- ↑ Annual (FY) Japanese Home Console Hardware Shipments, Nihon Keizai Shimbun (Nikkei)
- ↑ https://farm1.staticflickr.com/591/23262347663_dcc819d16e_b.jpg
- ↑ 24.0 24.1 PlayStation Cumulative Production Shipments of Hardware. Sony Computer Entertainment Inc. Archived from the original on 2011-05-24. Retrieved on 2008-03-22.. Note: These Japan sales figures include shipments to other Asian countries.
- ↑ 25.0 25.1 25.2 25.3 25.4 25.5 Consolidated Sales Transition by Region (PDF). Nintendo (2012-10-23). Archived from the original on 2012-11-12. Retrieved on 2012-10-24.
External links
| Prev: Fourth generation of video games | Generations | Next: Sixth generation of video games |