The 2009 fiscal year for Nintendo and Sony began April 1, 2008 and will end on March 31, 2009. Microsoft's sales earning report entails the period from July 1, 2008 to June 30, 2009.
- See also: 2008 fiscal year
Fiscal year sales table[]
- See also: 2008 fiscal year and 2010 fiscal year table for comparisons
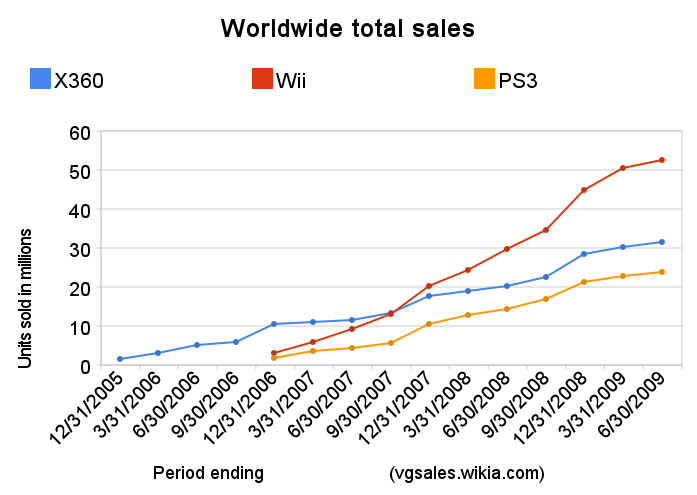
Worldwide shipments for Wii, PS3, X360
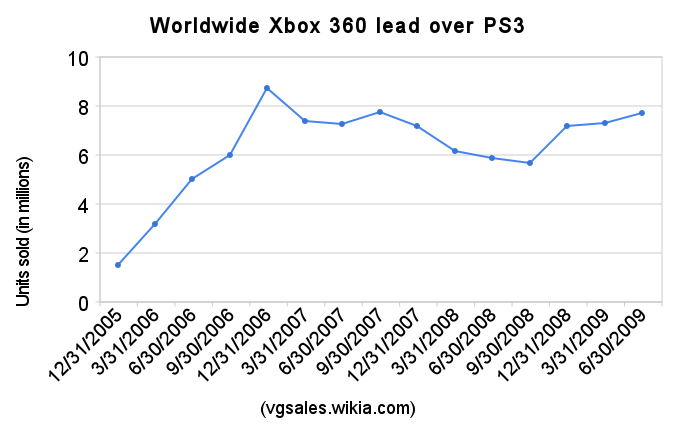
Worldwide difference between PS3 and Xbox 360. (X360 US/Japan/Europe launch in Nov/Dec 2005. PS3 launch in Nov 2006 in US/Japan, March 2007 in Europe)
| Console | Quarter 1 | Quarter 2 | Quarter 3 | Quarter 4 | Fiscal year 09 | Lifetime |
|---|---|---|---|---|---|---|
| Wii | 5.17 | 4.93 | 10.42 | 5.43 | 25.95 | 50.39m |
| PlayStation 3 | 1.56 | 2.43 | 4.46 | 1.61 | 10.06 | 22.73* |
| Xbox 360 | 2.20 | 6.00 | 1.70 | 1.20 | 11.20 | 31.50 |
| Nintendo DS | 6.94 | 6.79 | 11.89 | 5.56 | 31.18 | 101.78 |
| PSP | 3.72 | 3.18 | 5.08 | 2.13 | 14.11 | ~53.39[1] |
| PlayStation 2 | 1.51 | 2.50 | 2.52 | 1.38 | 7.91 | ~137.70[2][3] |
*Sony adjusted the lifetime totals for the PS3.[4]
- Note: Microsoft's fiscal year is not aligned with Nintendo or Sony. Microsoft's Q1 corresponds to Nintendo's and Sony's Q2.
- Note2: Official sources can be accessed below.
Forecast[]
Official forecasts for the 2009 fiscal year given by Sony, Nintendo and Microsoft.
- PS3 - 10 million[5]
- PSP - 15 million[6] (revised from 16 million[7], and 15 million)
- PS2 - 8 million[8] (down from 9 million)
- Wii - 26.5m [9] (previously 27.5 million[10], 26.5 million, and 25 million[11])
- NDS - 31.5 million (revised from 30.5[12], and 28m[13])
- X360 - no forecast given
Nintendo[]
The Nintendo 2009 fiscal year goes from April 1, 2008 to March 31, 2009.
Yearly sales and profits[]
- Wii - 25.95 million
- Nintendo DS - 31.18 million
- Game Boy Advance - 0.42 million
- Net sales: $18.5 billion
- Operating income: $5.6 billion
Major releases[]
- Nintendo DSi
- Wii Fit
- Mario Kart Wii
- Wii Music
- Animal Crossing: City Folk
- Mario Super Sluggers
References[]
- Q1: Nintendo’s Profits Continue to Rise (official)
- Q2: Nintendo Posts 9.4% Profit Gain (official) (more)
- Q3: (official)
- Q4: Nintendo Reports Record Annual Sales, Profits more(official)(more)
Sony[]

Sony FY09 results

Sony 2009 fiscal year goes from April 1, 2008 to March 31, 2009.
Note: Sony adjusted their PS3 total from 22.91 to 22.73 back in March and therefore changed a few quarters.[14]
Yearly sales and profits[]
Sony revised it's previous quarters numbers, presumably to meet this year's 10m forecast.[15]
- Games division net sales: $11 billion
- Operating income: -$612.4 million
Major releases[]
- PSP-3000
- LittleBigPlanet
- Home
- Resistance 2
- Killzone 2
- Metal Gear Solid 4
References[]
- Q1: Sony Posts Game Gains in Q1 2009 (official)
- Q2: Sony Game Revenues Up 10 Percent On Reduced Loss (official)
- (official)
- Q4: Sony Game Segment Posts Loss Despite Improving PS3 Business more (official more)
Microsoft[]
Microsoft's 2009 fiscal year began July 1, 2008 and will end June 30, 2009.
Yearly sales and profits[]
Entertainment division only:
- Revenue: $7.7 billion (-6% YoY)
- Profit: $169m (-66%)
Major releases[]
- Gears of War 2
- Fable 2
- Halo Wars
References[]
- Q1: Xbox Division Maintains Profit in Q1 (official)
- Q2: Microsoft Slashing 5,000 Jobs (Official)
- Q3: Microsoft Slumps In Third Quarter As Xbox 360 Sales Swell
- Microsoft games revenues fall by 3 percent (official)
Other publishers[]
- Ubisoft - Q1 Q2 Q3 Q4
- Electronic Arts - Q1, Q2 FY09
- Capcom - Q1
- THQ - Q1
- Activision - Q1 FY 09
- Konami - Q1 Q4
- Sega - Q1 Q4
See also[]
References[]
- ↑ http://www.computerandvideogames.com/article.php?id=208211%3fcid&skip=yes
- ↑ http://www.neogaf.com/forum/showthread.php?t=361620
- ↑ http://www.scei.co.jp/corporate/release/pdf/090331ae.pdf
- ↑ http://www.neogaf.com/forum/showthread.php?t=361620&page=4
- ↑ http://www.pcworld.com/businesscenter/article/152972/sony_reduces_operating_loss_at_playstation_division.html
- ↑ http://www.sony.net/SonyInfo/IR/financial/fr/viewer/08revision2/
- ↑ http://www.pcworld.com/businesscenter/article/152972/sony_reduces_operating_loss_at_playstation_division.html
- ↑ http://www.sony.net/SonyInfo/IR/financial/fr/viewer/08revision2/
- ↑ http://www.nintendo.co.jp/ir/pdf/2006/061026e.pdf
- ↑ http://www.edge-online.com/news/nintendo-extends-wii-sales-target
- ↑ http://www.edge-online.com/news/nintendo-raises-full-year-profit-forecast-26
- ↑ http://www.edge-online.com/news/nintendo-raises-full-year-profit-forecast-26
- ↑ http://www.nintendo.co.jp/ir/pdf/2006/061026e.pdf
- ↑ http://www.neogaf.com/forum/showpost.php?p=16906825&postcount=257
- ↑ http://www.neogaf.com/forum/showthread.php?t=361620&page=4